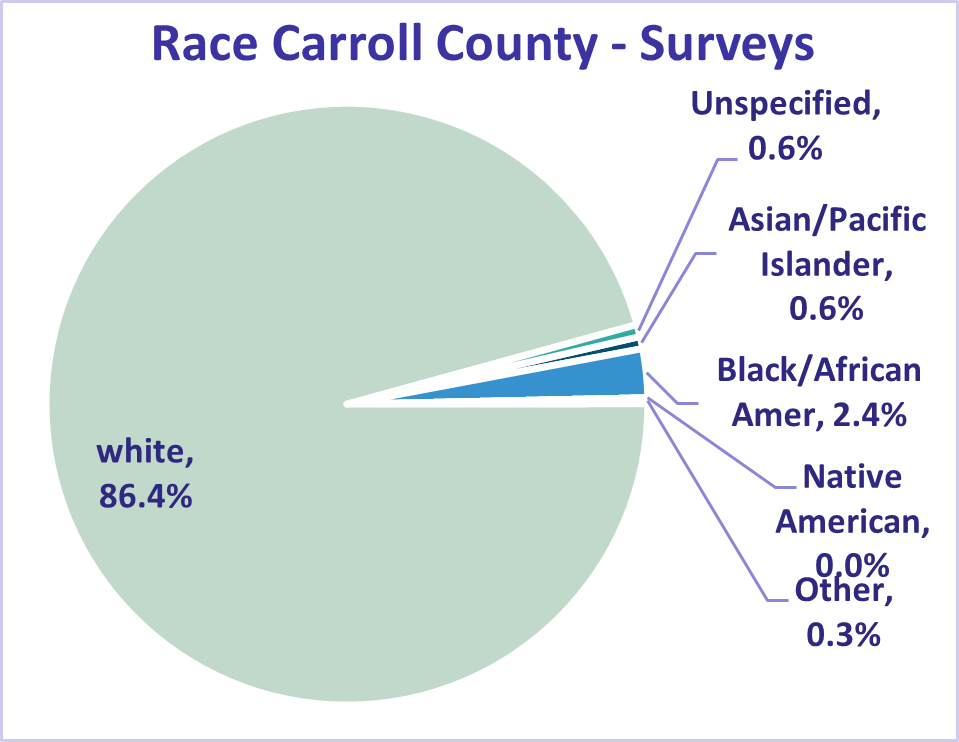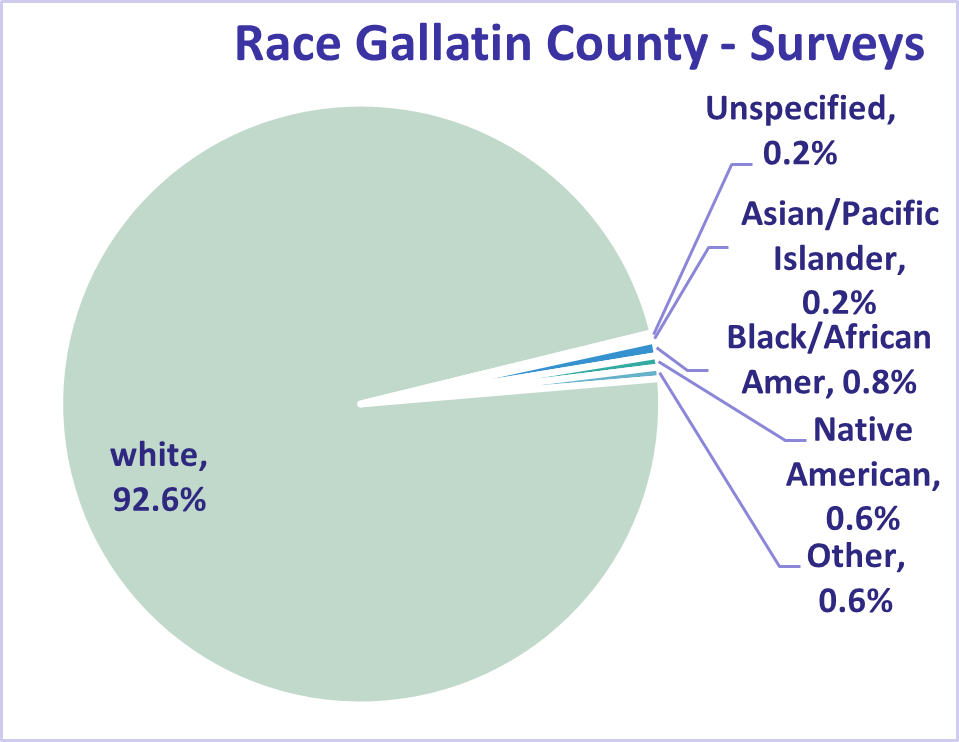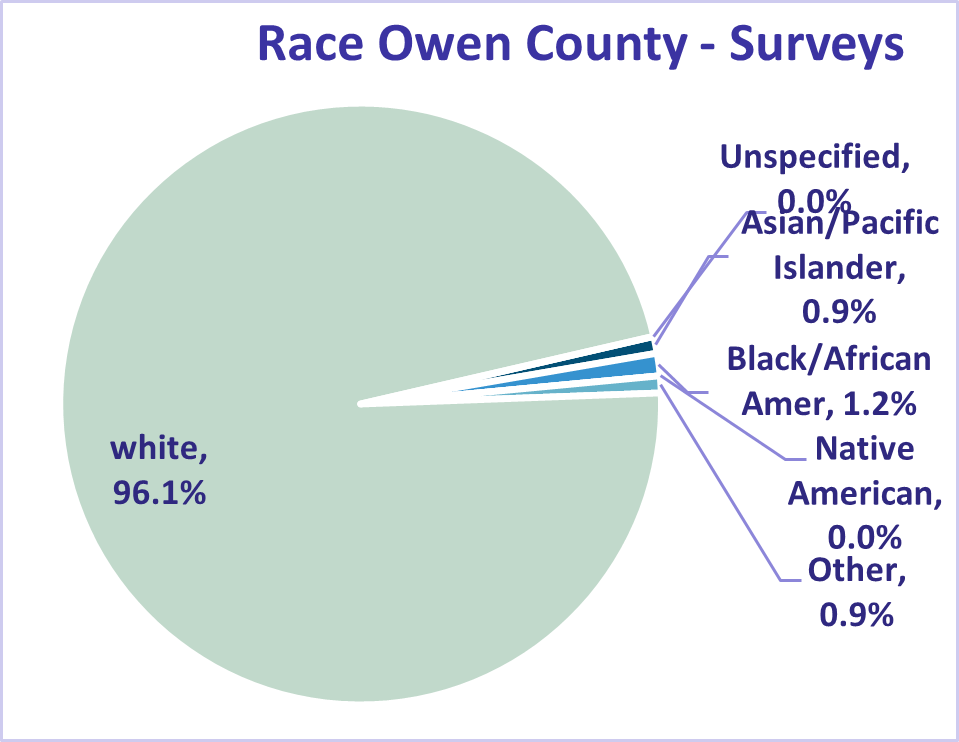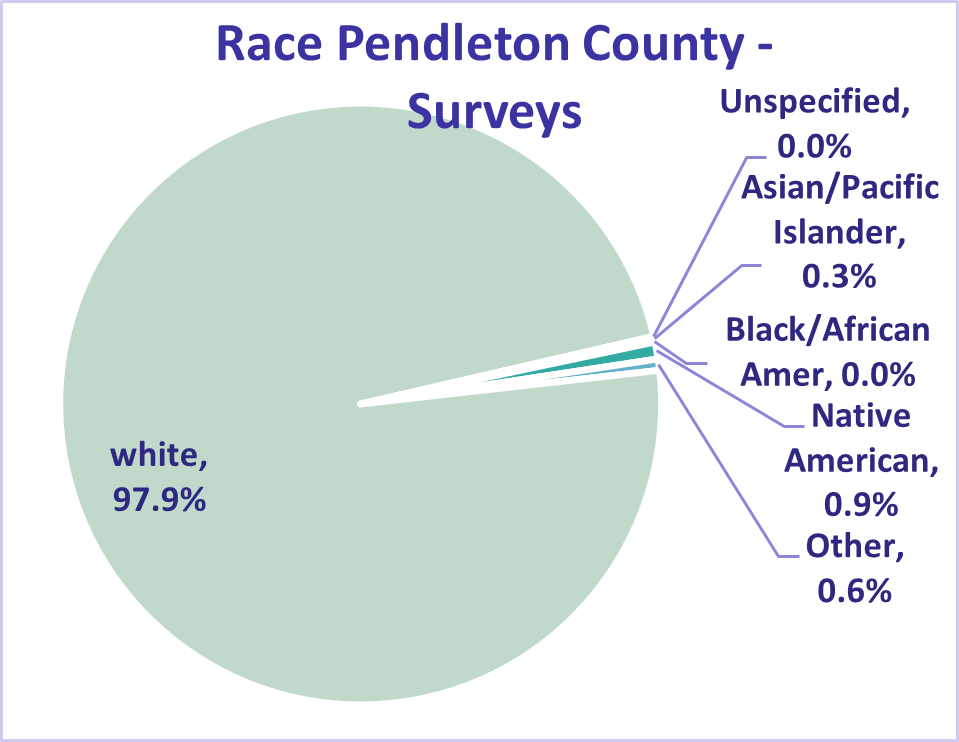
PARTICIPANT RACES
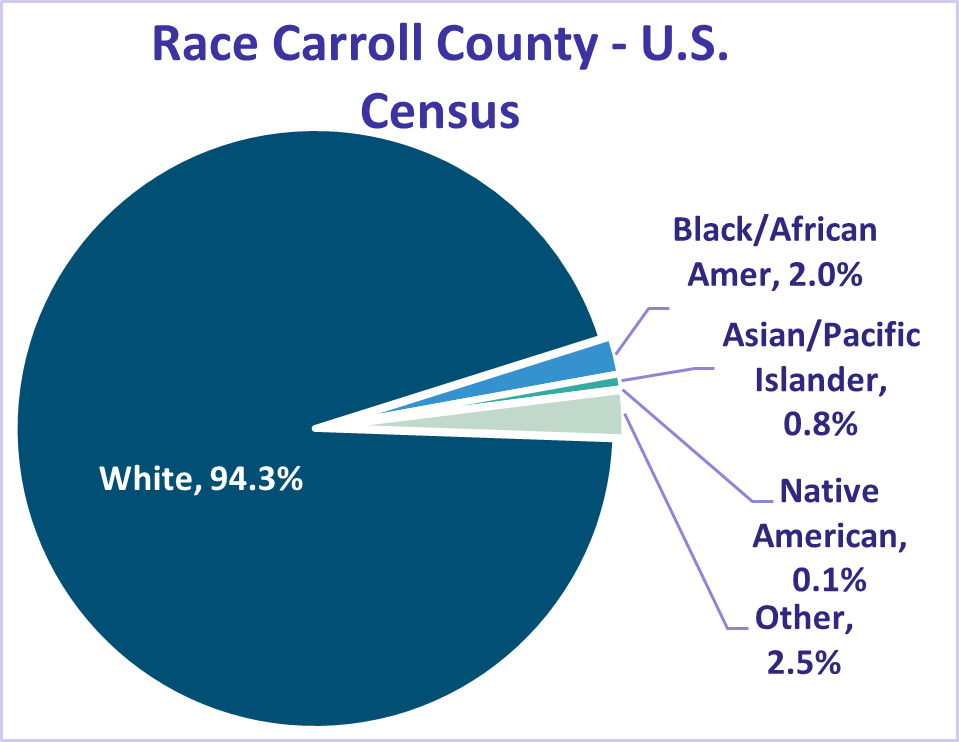
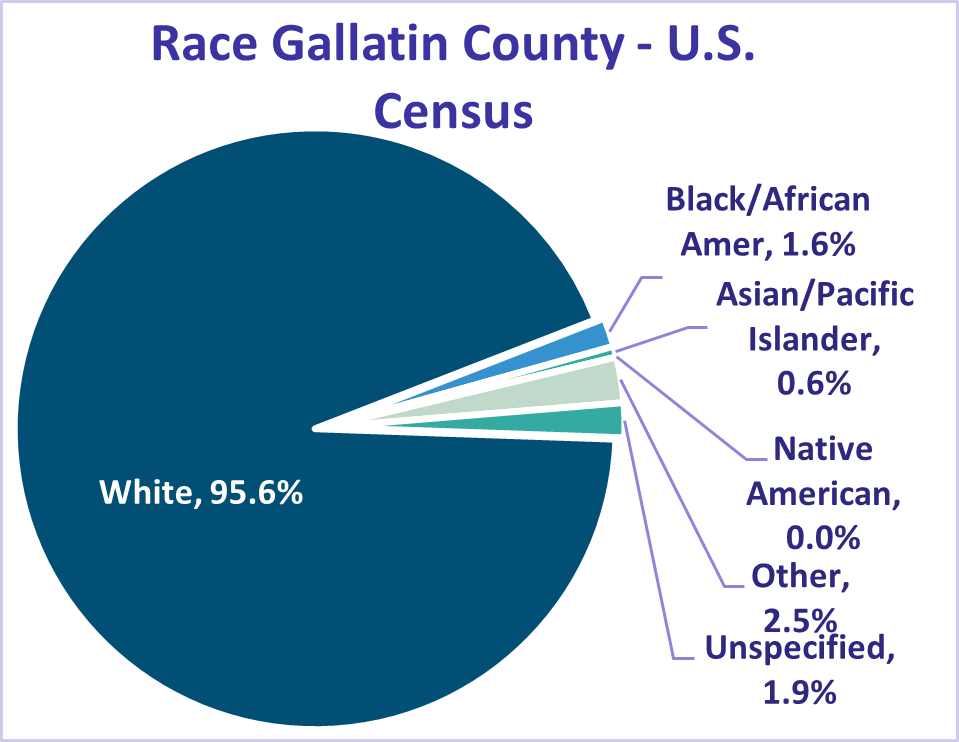
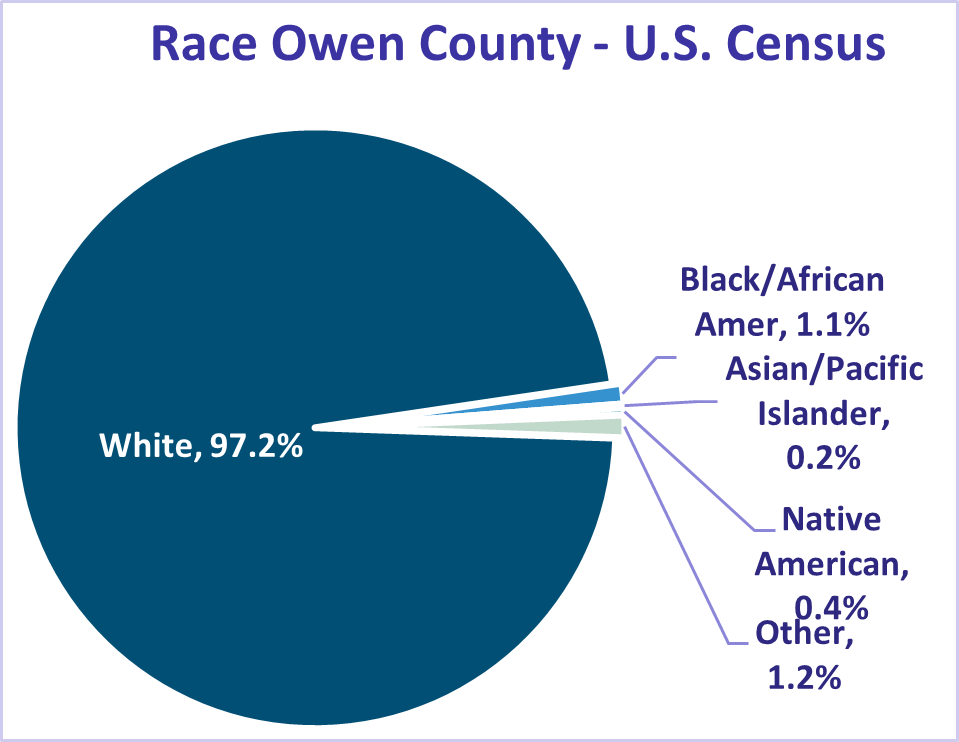
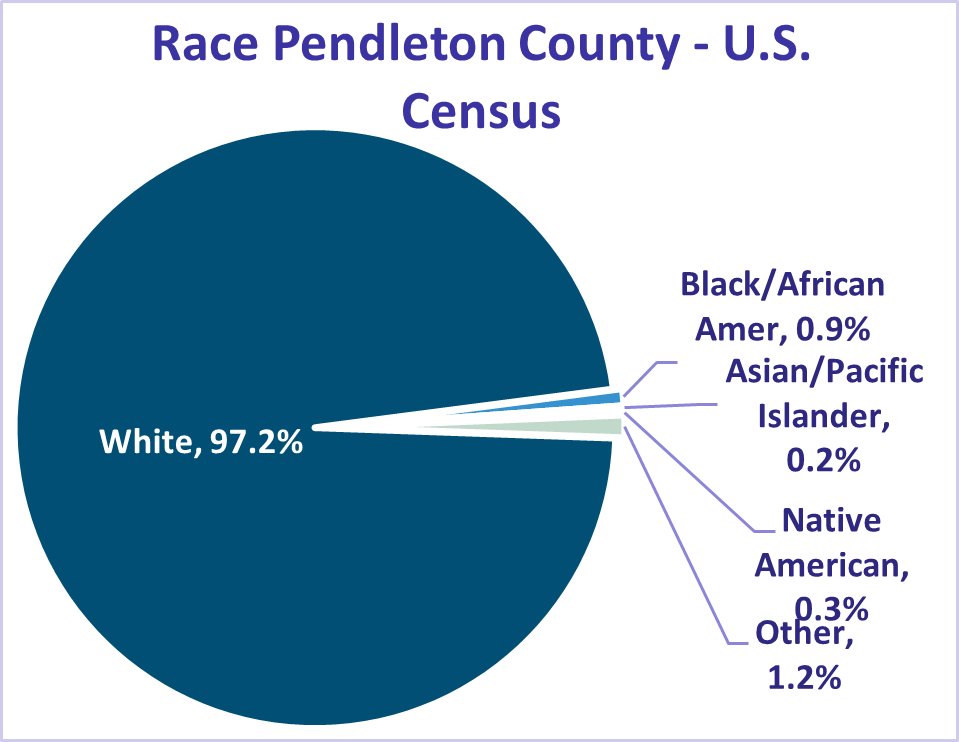
Population estimates as published by the United States Census Bureau 2019, reflect slightly higher estimates of the race white alone as compared with our survey respondents in Carroll, Gallatin, and Owen counties and slightly lower estimates in Pendleton county. When the pool of respondents has a higher representation of ethnicities or races other than white as compared with the general population, such variances can be useful in more readily identifying disparities among non-white races for planning and intervention on survey topics included.
"Asian/Pacific Islander - Black or African American - Native American or Alaska Native - Other - White - Unspecified"
| Asian/Pacific Islander | Black or African/American | Native American or American Indian | Other | White | Unspecified | Total | |
|---|---|---|---|---|---|---|---|
| Carroll | 2 | 8 | 0 | 1 | 293 | 2 | 306 |
| Gallatin | 1 | 4 | 3 | 3 | 474 | 1 | 486 |
| Owen | 3 | 4 | 0 | 3 | 321 | 0 | 331 |
| Pendleton | 1 | 0 | 3 | 2 | 323 | 0 | 329 |
| Total | 7 | 16 | 6 | 9 | 1,411 | 3 | 1,452 |