PARTICIPANT GENDER
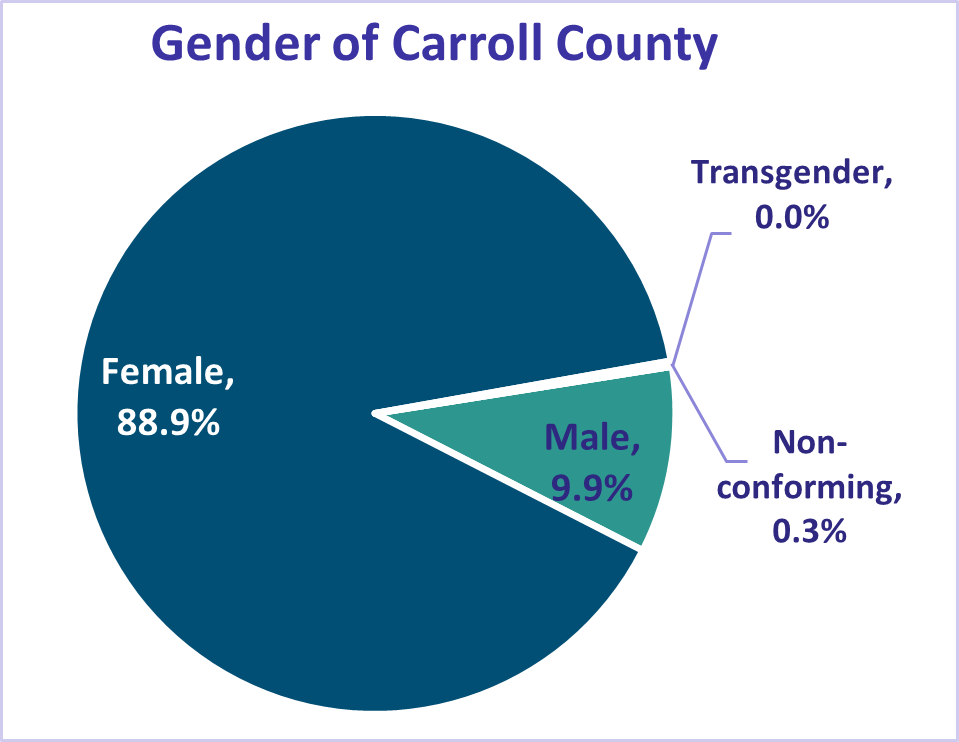
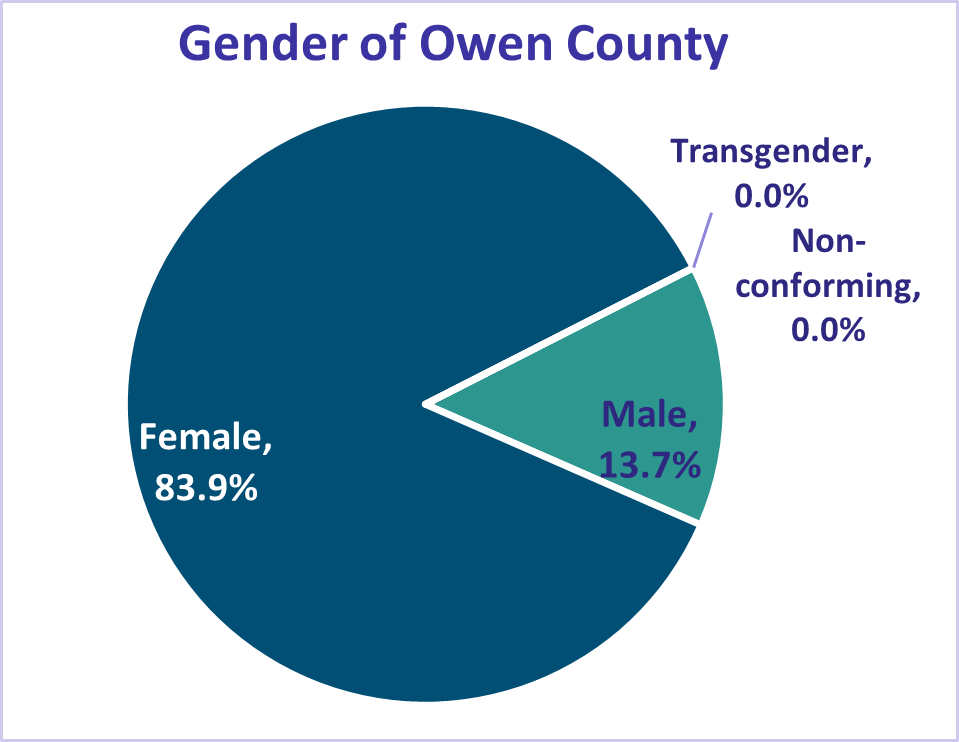
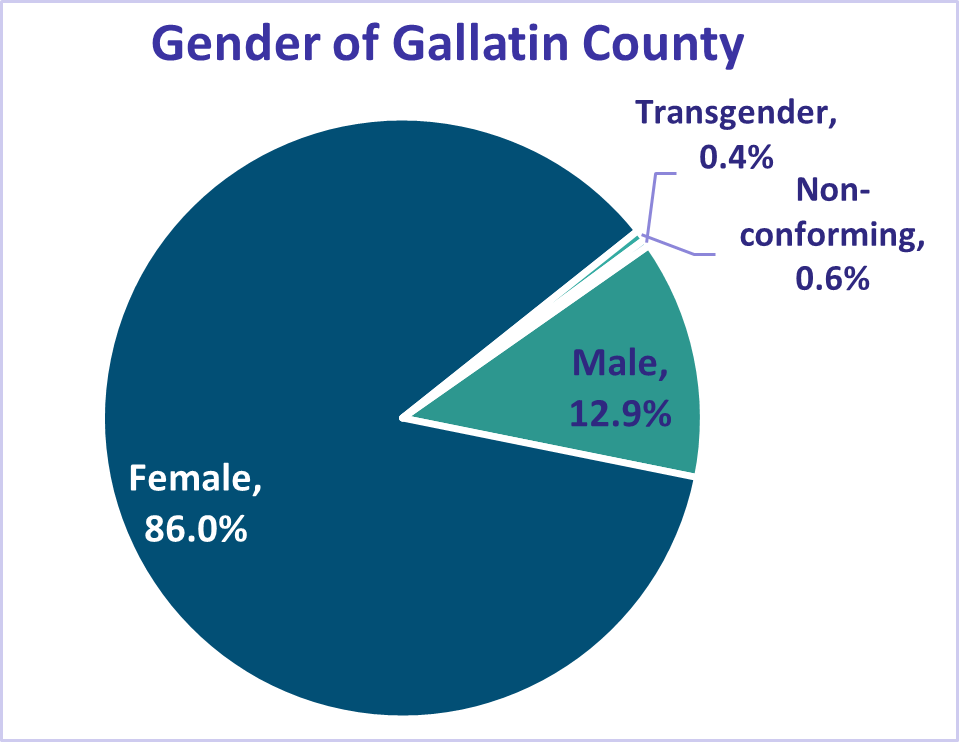
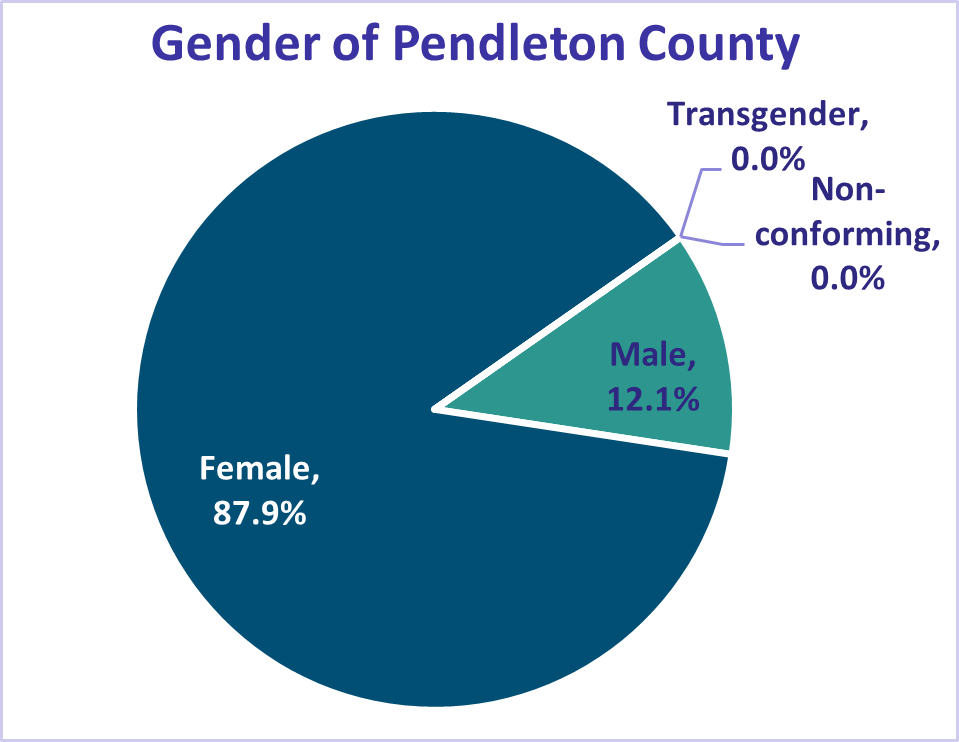
The vast majority of respondents were female, representing a composite of 87.3% of all respondents, male representing 12.3%, and transgender or non-conforming representing .4%.
The survey availability was promoted through online social media platforms including Facebook, at local county MAPP community meetings, and offered for a period of six months from August 2019 to Mar 2020.
"Carroll / Gallatin / Owen / Pendleton Counties"
| Male | Female | Non-Conforming | Transgender | Total | |
|---|---|---|---|---|---|
| Carroll | 34 | 304 | 1 | 0 | 339 |
| Gallatin | 66 | 441 | 3 | 2 | 512 |
| Owen | 47 | 287 | 0 | 0 | 334 |
| Pendleton | 40 | 290 | 0 | 0 | 330 |
| Total | 187 | 1,322 | 4 | 2 | 1,515 |