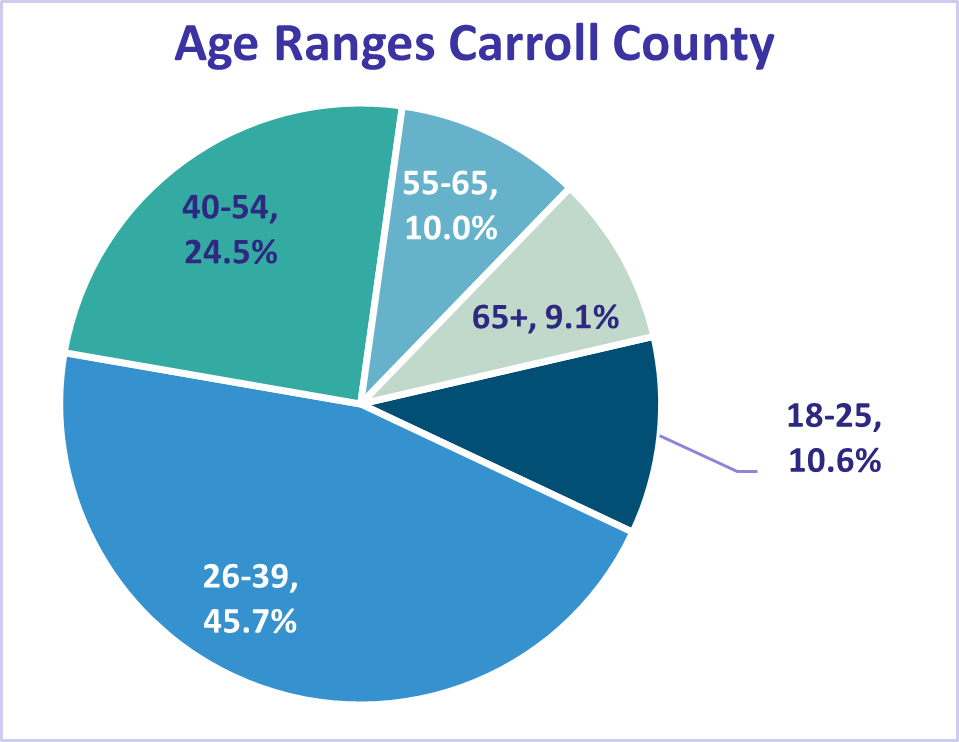
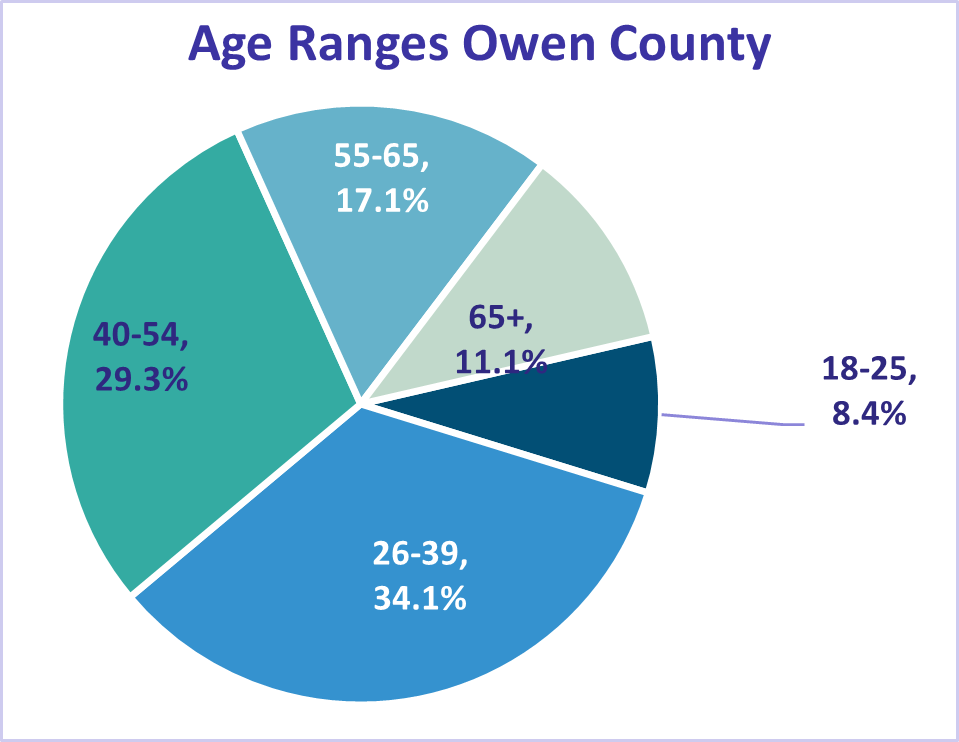
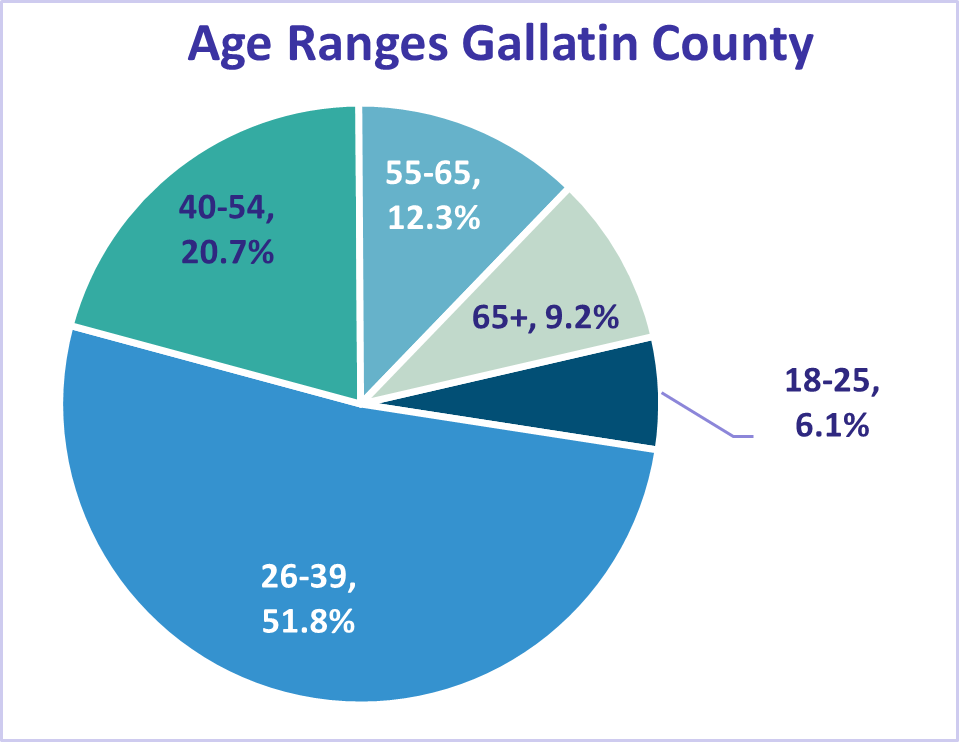
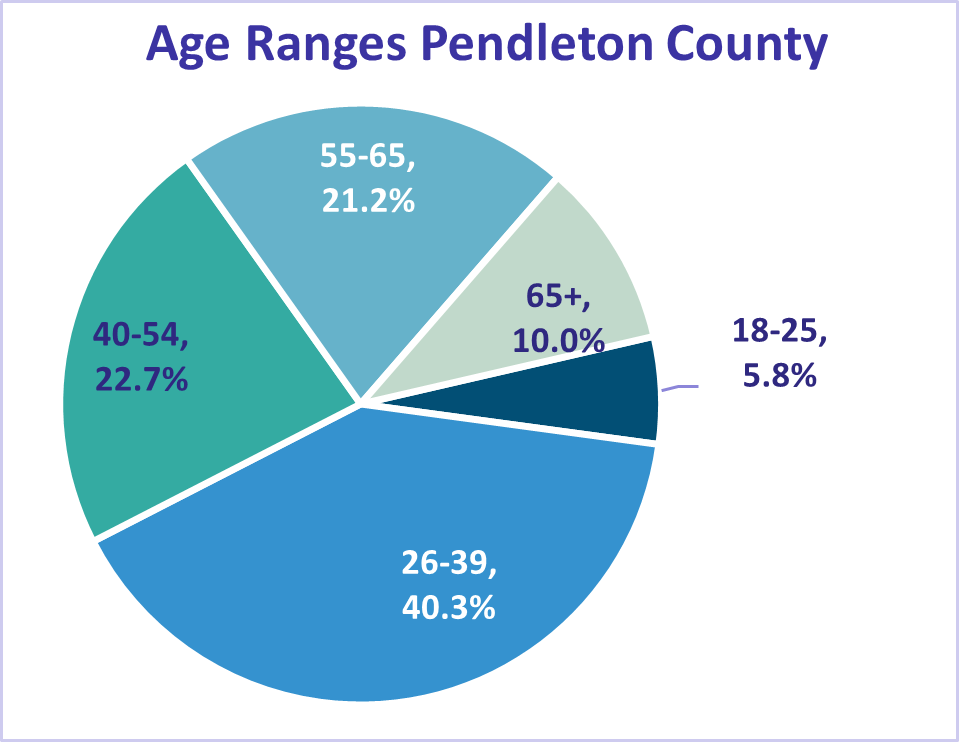
AGES REPRESENTED
Most survey respondents represent those who are between the ages of 26 and 39, representing 44% across all four counties followed by those between the ages of 40 and 54 at 23.9%. The lowest age demographic represented includes those under the age of 26 at only 7.5% of respondents.
| 18-25 | 26-39 | 40-54 | 55-65 | 65+ | Total | |
|---|---|---|---|---|---|---|
| Carroll | 36 | 155 | 83 | 34 | 31 | 339 |
| Gallatin | 31 | 265 | 106 | 63 | 47 | 512 |
| Owen | 28 | 114 | 98 | 57 | 37 | 334 |
| Pendleton | 19 | 133 | 75 | 70 | 33 | 330 |
| Total | 114 | 667 | 362 | 224 | 148 | 1,515 |