HEALTH EQUITY SCORECARD OWEN COUNTY
INTRODUCTION
The equity scorecard is a tool and resource for evaluating how the various geographical, economic, and population make-up affect the health of a particular area or group. Inequities can be found in people of varying races and ethnicities, as well as in people who live in a particular geography, regardless of race or ethnicity. The scorecard framework is aligned with social determinants of health and will aide in the development of practical strategies to assist with implementing institutional change that will lead to equitable health outcomes for all persons.
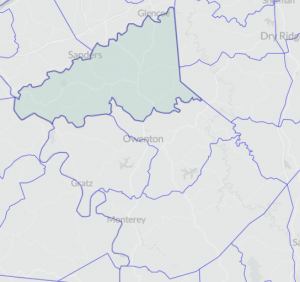
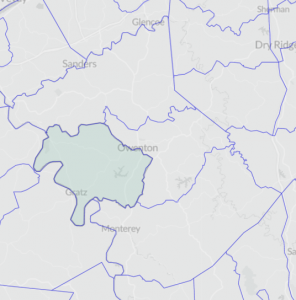
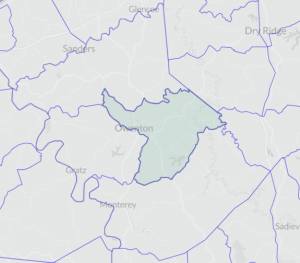
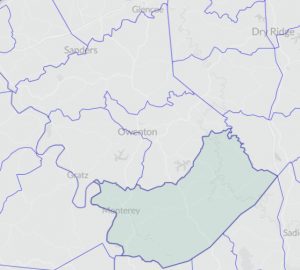
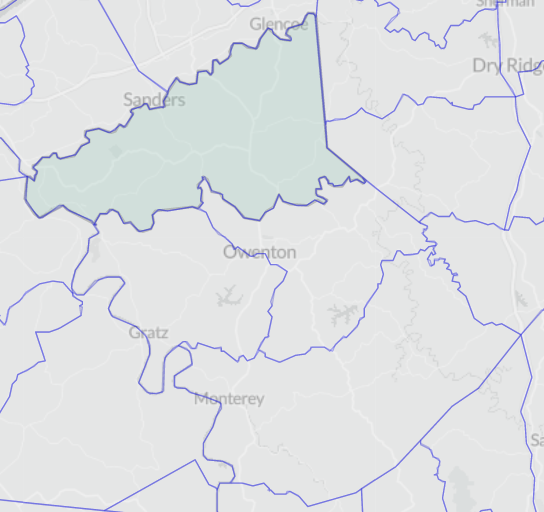
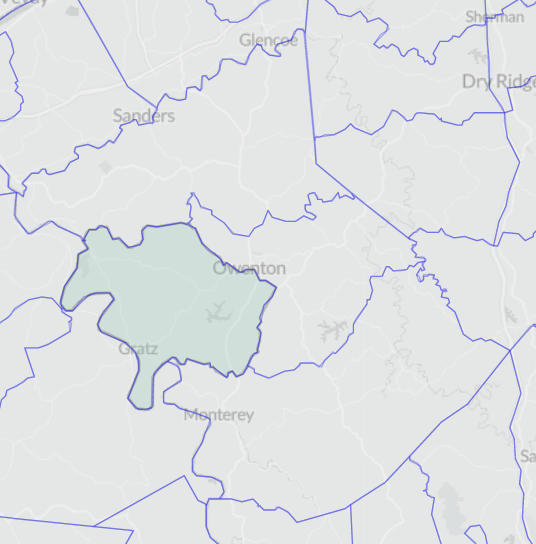
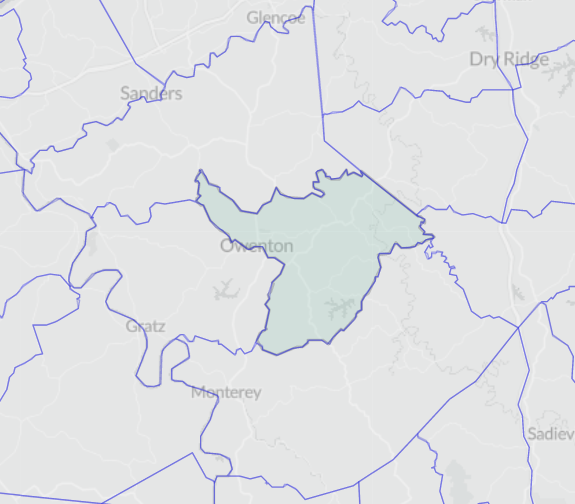
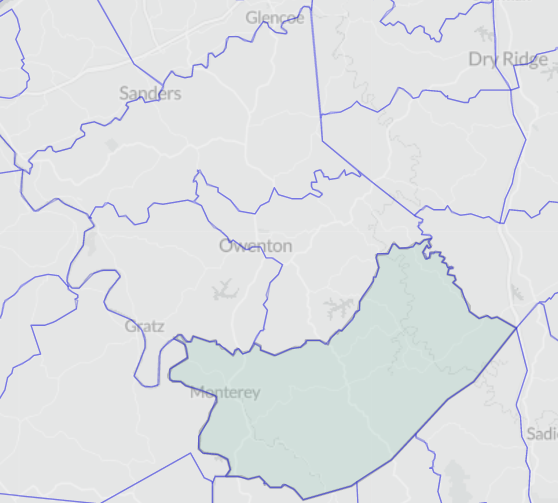
CENSUS TRACTS
Census tracts are small, permanent statistical subdivisions of a county. Each is uniquely numbered with a numeric code. Each tract generally averages about 4,000 inhabitants with a minimum population of 1,200 and a maximum of 8,000.
POPULATION
Understanding the data: Each number highlighted in red indicates the highest ratio and green represents the lowest ratio of the population to whites for the geographic area measured. Higher areas of segregation are often associated with poorer health outcomes and equity.
| Indicator | Measure | Years | Type | CT9701 | CT9702.01 | CT9702.02 | CT9703 |
|---|---|---|---|---|---|---|---|
| Population | White | 2019-23 | Quantity | 2,815 | 2,689 | 2,721 | 2,767 |
| Black/African American | 2019-23 | Quantity | 1 | 9 | 31 | 0 | |
| Other Race(s) | 2019-23 | Quantity | 121 | 17 | 35 | 175 | |
| Hispanic | 2019-23 | Quantity | 271 | 4 | 3 | 0 | |
| Not Hispanic | 2019-23 | Quantity | 2,815 | 2,689 | 2,721 | 2,767 | |
| Ratio of Whites to each African American Resident | 2019-23 | Ratio | 2,815 | 299 | 88 | 0 | |
| Ratio of Whites to each Other Race Resident | 2019-23 | Ratio | 23 | 158 | 78 | 16 | |
| Ratio of Non-Hispanics to each Hispanic Resident | 2019-23 | Ratio | 10 | 672 | 907 | 0 | |
| Community | Dissimilarity Index – African American | 2019-23 | Index | -.23 | -.03 | 0.51 | -.25 |
| Dissimilarity Index – Hispanic | 2019-23 | Index | .72 | -.23 | -.24 | -.25 |
Observations
The distribution of the ratio of the African American population is primarily segregated in Census Tract 9702.02, Owenton and Hesler, where the ratio of Whites to African Americans is 88 to 1. Conversely, there are 2,815 whites per African American in CT 9701.
To completely desegregate Owen County, 51% of African Americans would need to move out of CT9702.02, Owenton, and 72% of Hispanics from the CT9701. It is important to note, however, that segregation can occur in smaller geographic areas, including neighborhoods or even streets. Consequently, simply increasing the population dispersal by census tract may have little to no impact on health status and/or segregation. Given the county’s rurality and population size, neighborhood- and street-level data are not available.
EDUCATION AND INCOME
Understanding the data: There is generally a direct correlation between level of education and median household income for a population. Income affects health in a variety of ways including access to care, higher rates of obesity, and higher rates of smoking all of which are linked with poorer health outcomes.
The gini index measures the distribution of income across a population. The higher the index value, the less income is spread across the population and the more income fewer people have than the majority of the population.
| Indicator | Measure | Years | Type | CT9701 | CT9702.01 | CT9702.02 | CT9703 |
|---|---|---|---|---|---|---|---|
| Income | Median HH Income | 2019-23 | Dollars | -1,352 | -7,697 | 15,928 | 4,223 |
| Inequality Index – Gini | 2019-23 | Index | 0.4974 | 0.3642 | 0.3802 | 0.4008 | |
| Education | Individuals 25 and over with no high school diploma | 2019-23 | Percent | 17.4 | 10.9 | 14.3 | 20.5 |
Observations
Persons living in CT 9702.01, Perry Park/Gratz, are at a significant economic disadvantage compared with the median household income in Owen County, with a median household income that is $7,697 below the average Owen County household.
Income is most evenly distributed among households in CT 9702.01, with a Gini index of .3642, which measures the dispersion of income across the entire distribution. Where 0 is a perfect income distribution and 1 is a perfect inequitable distribution. The U.S. Gini index 5-year estimates for 2023 are .48, and Kentucky is .48.
HOUSING
Understanding the data: Poor housing quality and inadequate conditions such as overcrowding, incomplete or the lack of a kitchen, and access to a vehicle can lead to poorer health outcomes including chronic disease and injury. Areas with higher rates suffer more disadvantages that can affect health outcomes than in other areas of the same population.
| Indicator | Measure | Years | Type | CT9701 | CT9702.01 | CT9702.02 | CT9703 |
|---|---|---|---|---|---|---|---|
| Housing | Homeowner with a mortgage 35% or more of HH Income | 2018-21 | Percent | 10.8 | 11.8 | 25.9 | 42.2 |
| Homeowner without mortgage 35% or more of HH Income | 2018-21 | Percent | 16.8 | 1.4 | 3.0 | 7.1 | |
| Rental costs 35% or more of HH income | 2018-21 | Percent | 0.0 | 26.5 | 29.8 | 29.9 | |
| Occupied housing units without access to a vehicle | 2018-21 | Percent | 3.2 | 1.8 | 4.5 | 1.8 | |
| Occupied housing units lacking a complete kitchen | 2018-21 | Percent | 0.60 | 0.0 | 0.0 | 0.1 | |
| Occupied housing units with more than 1.51 occupants per room | 2018-21 | Percent | 0.0 | 0.0 | 0.0 | 0.3 | |
| Proportion of children under 18 in single parent household | 2018-21 | Percent | 36.0 | 31.0 | 8.0 | 25.0 | |
| Median owner-occupied housing unit value | 2018-21 | Dollars | 96,300 | 108,800 | 136,800 | 148,700 |
Observations
- Thirty-six percent of children under 18 living in a single parent household live in CT 9701, including Sparta, Jonesville, Long Ridge, New Liberty, Poplar Grove and Wheatley areas.
- In the Owenton/Hesler area, 4.5% of households are without access to a vehicle.
- Additionally, 42.2% of households having a mortgage that is more than 35% of their household income live in CT 9703.
HEALTH STATUS AND HEALTH RISK BEHAVIORS
Understanding the data: Each measure highlighted in red reflects poorer health status, less compliance with prevention services and higher rates of the population participating in risky health behaviors.
A population’s current health status and health risk behaviors are good indicators for identifying opportunities for action to help improve health outcomes.
| Indicator | Measure | Years | Type | CT9701 | CT9702 | CT9703 |
|---|---|---|---|---|---|---|
| Health Status | Physical health not good for >=14 days among adults aged >=18 years | 2020 | Percent | 15.4 | 15.6 | 16.6 |
| Fair or poor self-rated health status among adults aged >=18 years | 2020 | Percent | 22.8 | 23.0 | 24.5 | |
| Mental health not good for >=14 days among adults aged >=18 years | 2020 | Percent | 18.7 | 18.7 | 19.6 | |
| Prevention | Cervical cancer screening among adult women aged 21-65 years | 2020 | Percent | 79.9 | 79.9 | 79.2 |
| Cholesterol screening among adults aged >=18 years | 2019 | Percent | 89.7 | 89.0 | 89.1 | |
| Fecal occult blood test, sigmoidoscopy, or colonoscopy among adults aged 50-75 years | 2020 | Percent | 69.3 | 69.5 | 67.8 | |
| Mammography use among women aged 50-74 years | 2020 | Percent | 72.0 | 71.9 | 71.1 | |
| Older adult men aged >=65 years who are up to date on a core set of clinical preventive services: Flu shot past year, PPV shot ever, Colorectal cancer screening | 2020 | Percent | 41.3 | 41.6 | 40.4 | |
| Older adult women aged >=65 years who are up to date on a core set of clinical preventive services: Flu shot past year, PPV shot ever, Colorectal cancer screening, and Mammogram past 2 years | 2020 | Percent | 37.1 | 37.2 | 36.3 | |
| Taking medicine for high blood pressure control among adults aged >=18 years with high blood pressure | 2019 | Percent | 77.6 | 78.3 | 77.3 | |
| Visits to dentist or dental clinic among adults aged >=18 years | 2020 | Percent | 49.7 | 50.0 | 47.4 | |
| Visits to doctor for routine checkup within the past year among adults aged >=18 years | 2020 | Percent | 75.9 | 76.0 | 75.4 | |
| Current lack of health insurance among adults aged 18-64 years | 2020 | Percent | 12.4 | 11.7 | 13.0 | |
| Health Risk Behaviors | Binge drinking among adults aged >=18 years | 2020 | Percent | 15.3 | 15.1 | 15.5 |
| Current smoking among adults aged >=18 years | 2020 | Percent | 26.7 | 25.9 | 29.0 | |
| No leisure-time physical activity among adults aged >=18 years | 2020 | Percent | 34.3 | 34.2 | 35.5 | |
| Sleeping less than 7 hours among adults aged >=18 years | 2020 | Percent | 37.5 | 36.9 | 38.1 |
Observations
- Census Tract 9702 was redistricted into 9702.01 and 9702.02 as of the 2020 census. The vast majority of health status measures and prevention actions are the poorest in CT 9703, encompassing the Lusby’s Mill, Monterey, and New Columbus areas.
- Additionally, populations with the highest level of health risk behaviors also live in CT 9703.
HEALTH OUTCOMES
Understanding the data: Health outcomes are those conditions or events that occur as a result of lack of intervention, poor health behaviors, and other social determinants of health that affect one’s health status. Outcomes can have a direct impact on one’s overall health. As an example, those who have strokes can lose their ability to care for themselves, experience paralysis, and lose their ability to get exercise resulting in obesity and additional health issues.
| Indicator | Measure | Years | Type | CT9701 | CT9702 | CT9703 |
|---|---|---|---|---|---|---|
| Health Outcomes | All teeth lost among adults aged >=65 years | 2020 | Percent | 22.0 | 22.0 | 23.8 |
| Arthritis among adults aged >=18 years | 2020 | Percent | 33.0 | 34.0 | 34.0 | |
| Cancer (excluding skin cancer) among adults aged >=18 years | 2020 | Percent | 6.6 | 7.1 | 6.6 | |
| Chronic kidney disease among adults aged >=18 years | 2020 | Percent | 3.3 | 3.4 | 3.4 | |
| Chronic obstructive pulmonary disease among adults aged >=18 years | 2020 | Percent | 11.6 | 12.0 | 12.8 | |
| Coronary heart disease among adults aged >=18 years | 2019 | Percent | 8.2 | 8.5 | 8.5 | |
| Current asthma among adults aged >=18 years | 2020 | Percent | 11.5 | 11.6 | 11.9 | |
| Depression among adults aged >=18 years | 2020 | Percent | 26.4 | 26.6 | 27.6 | |
| Diagnosed diabetes among adults aged >=18 years | 2020 | Percent | 12.8 | 13.1 | 13.3 | |
| High blood pressure among adults aged >=18 years | 2019 | Percent | 42.9 | 43.3 | 43.7 | |
| High cholesterol among adults aged >=18 years who have been screened in the past 5 years | 2019 | Percent | 38.0 | 38.4 | 38.7 | |
| Obesity among adults aged >=18 years | 2020 | Percent | 39.4 | 38.7 | 40.1 | |
| Stroke among adults aged >=18 years | 2020 | Percent | 3.7 | 3.9 | 4.0 |
Observations
- Persons living in CT 9703 have the poorest health outcomes in the county ranking highest in 9 out of the 13 health outcomes and tying for the poorest outcomes in 3 additional measures.
MORTALITY
Understanding the data: Ratios are a comparison between two numbers. In this case we are comparing the rate at which the dominant race dies from a particular cause with the rate of which another race dies from the same cause. For example: 6.5 African Americans die for every white person that dies from hypertension or hypertensive renal disease.
#Parkinson disease (G20-G21) 1999-20Ratio16.50.0
| Indicator | Measure | Years | Type | Whites | African American/Black | Other Races |
|---|---|---|---|---|---|---|
| Cause of death | #Diseases of heart (I00-I09,I11,I13,I20-I51) | 1999-20 | Ratio | 1 | 1.7 | 0.5 |
| #Malignant neoplasms (C00-C97) | 1999-20 | Ratio | 1 | 1.2 | 0.4 | |
| #Accidents (unintentional injuries) (V01-X59,Y85-Y86) | 1999-20 | Ratio | 1 | 1.7 | 1.2 | |
| #Chronic lower respiratory diseases (J40-J47) | 1999-20 | Ratio | 1 | 1.1 | 0.0 | |
| #Cerebrovascular diseases (I60-I69) | 1999-20 | Ratio | 1 | 3.1 | 0.0 | |
| #Diabetes mellitus (E10-E14) | 1999-20 | Ratio | 1 | 0.0 | 0.0 | |
| #Nephritis, nephrotic syndrome and nephrosis (N00-N07,N17-N19,N25-N27) | 1999-20 | Ratio | 1 | 0.0 | 0.0 | |
| #Alzheimer disease (G30) | 1999-20 | Ratio | 1 | 1.4 | 0.0 | |
| #Influenza and pneumonia (J09-J18) | 1999-20 | Ratio | 1 | 2.8 | 0.0 | |
| #Septicemia (A40-A41) | 1999-20 | Ratio | 1 | 3.8 | 0.0 | |
| #Intentional self-harm (suicide) (*U03,X60-X84,Y87.0) | 1999-20 | Ratio | 1 | 2.0 | 0.0 | |
| #Essential hypertension and hypertensive renal disease (I10,I12,I15) | 1999-20 | Ratio | 1 | 3.0 | 0.0 | |
| #Chronic liver disease and cirrhosis (K70,K73-K74) | 1999-20 | Ratio | 1 | 0.0 | 0.0 | |
| #Aoritica aneurysm and dissection (I71) | 1999-20 | Ratio | 1 | 0.0 | 0.0 | |
| #Parkinson disease (G20-G21) | 1999-20 | Ratio | 1 | 0.0 | 0.0 |
Observations
- African Americans have much higher ratios of mortality for most of the top 16 causes of death in Owen County.
- Of particular note is the ratio of deaths from Septicemia among the African American population whereby 3.8 African American’s die for each White from the same cause.
Facebook
X
LinkedIn
- Published: February 9, 2023
- Page reviewed/updated: October 22, 2025